
Dr Soumyajyoti Biswas, Assistant Professor from the Department of Physics, has been keenly involved in intense research around areas like the statistical physics of fracture and breakdown in disordered materials and machine learning methods in predicting the imminent breakdown in disordered systems. He has recently published two articles titled “Success of social inequality measures in predicting critical or failure points in some models of physical systems” and “Evolutionary Dynamics of Social Inequality and Coincidence of Gini and Kolkata indices under Unrestricted Competition” in the journals Frontiers in Physics and International Journal of Modern Physics C respectively. The research was done in collaboration with various academicians and undergraduate students (BTech CSE and BSc Physics) from the Indian Statistical Institute, Kolkata and Saha Institute of Nuclear Physics, Kolkata.
It is known that physical systems behave erratically near critical points. Since the 1970s, the ‘erratic’ behaviour has been explained in terms of critical phenomena, and it was found that there are some robust patterns in classes of systems, e.g., all liquid-gas transitions have something in common. Those common patterns were quantified in terms of critical exponents – some numbers that belong to a particular class of systems.
The research shows that if the ‘erratic’ responses of systems near critical points are quantified by some measures of inequality indices (higher the values of the indices, higher the inequality), then such indices behave in a near-universal way for different physical systems, even if they belong in different universality classes. The articles have shown such behaviour in models of physical systems. They have also shown that in socio-economic data, which are also the systems that were conjectured to be in the self-organized critical state. The behaviour from real data matches very well with those from the model simulations.
The researchers have tested their observations from the model simulations to various socio-economic systems that were long conjectured to be in the state of self-organized criticality. Specifically, they have looked into the income inequalities in the US, inequality in citations of authors, inequality in income from movies, and inequality in fluctuations of Bitcoin markets. In all these systems, the participating agents compete among themselves without much external intervention.
In fact, the only system among these where there are some interventions is income inequality. They have shown that through data from the IRS in the US, that inequality has consistently grown in the 1980s till date and has been following the path predicted in our model simulations.
In future, they plan on continuing along this line of looking at critical behaviour in physical systems through inequality analysis. Particularly for the systems where the critical point can represent a catastrophic event (say, fracture) and it is important to quantify the distance from such a catastrophic point.
Abstract of the Research
In many physical systems, experimentally measurable quantities vary drastically near the critical point of such systems. For example, in liquids turning into gas, the densities fluctuate, similar fluctuations happen for magnetisation near critical temperature. We have shown that in systems where the critical point is self-organized i.e., the system reaches the critical point on its own, the unequal nature of their responses show nearly universal trends, even if the models belong to different universality class. This observation could then be used in physical and also socio-economic systems, to quantify their distance from critical point.
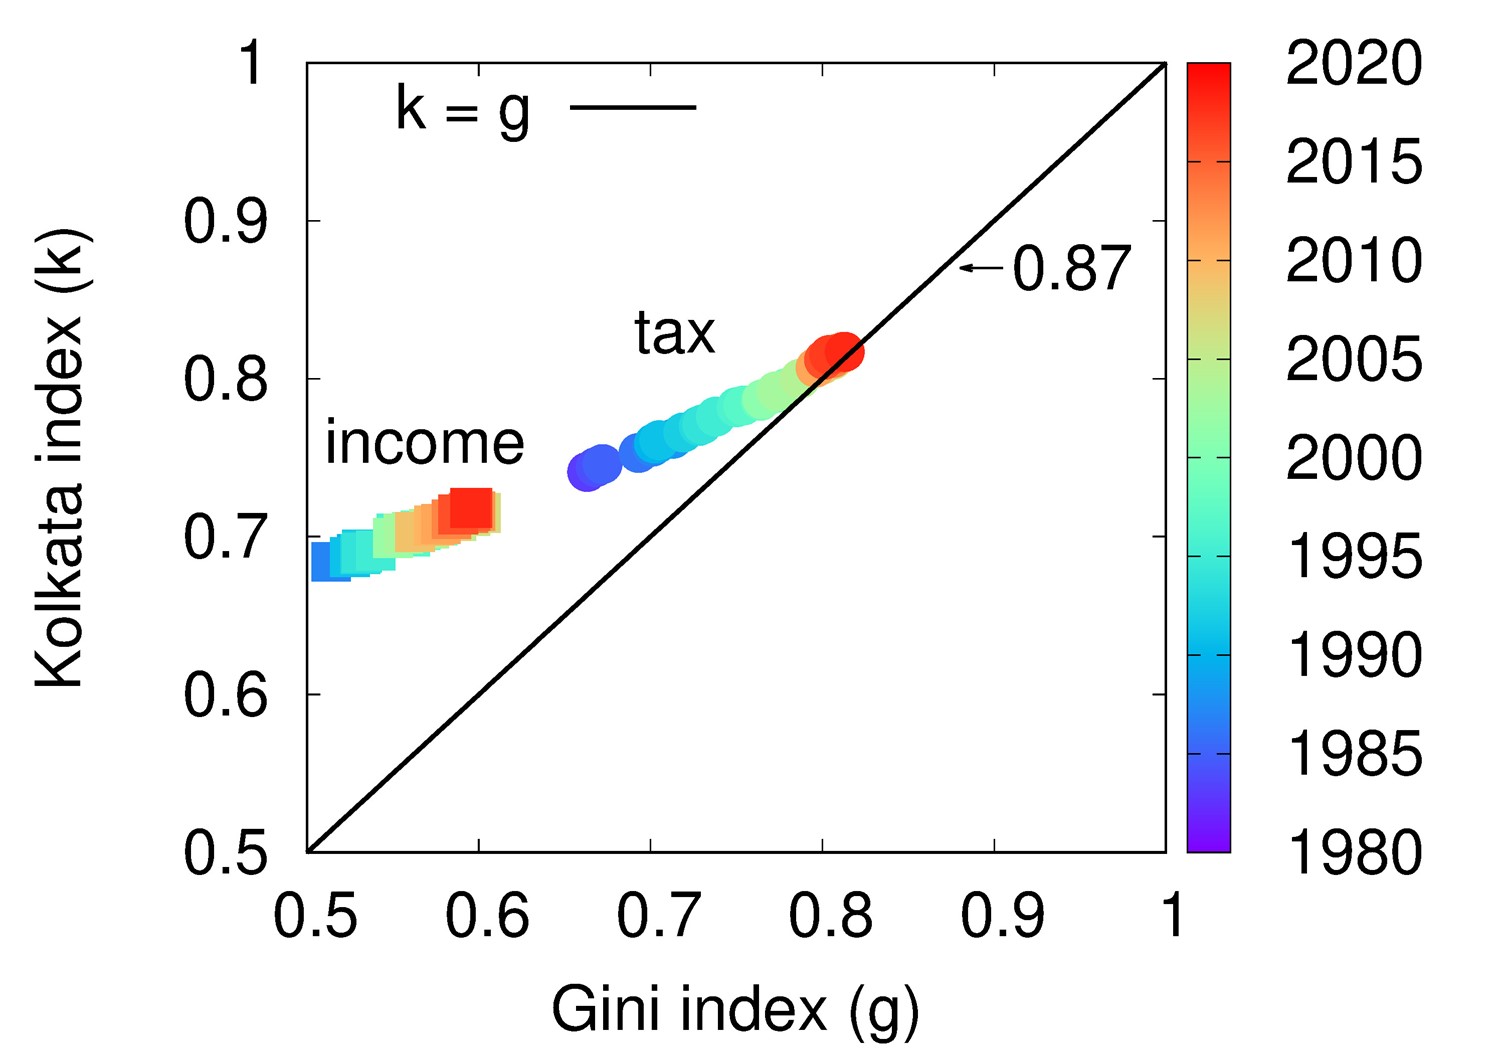
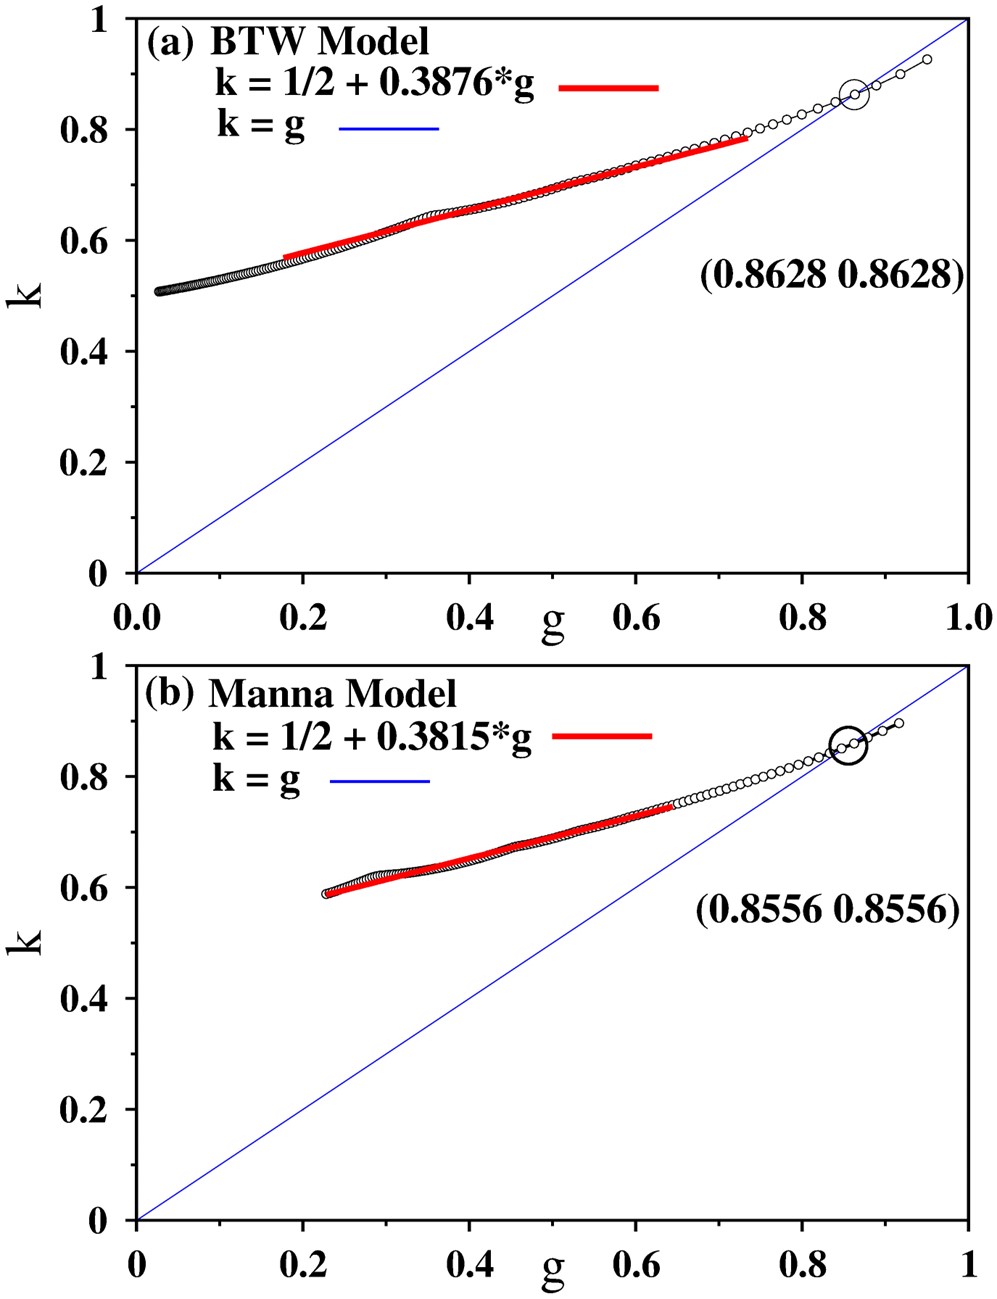 The right hand side figure illustrates the variation of the inequality indices and the circle indicates the critical point where the system is evolving towards. On the left hand side, the picture presents the same indices for income inequality in the US. It has been observed that the inequality has grown over the years and tending towards the saturation value (about 0.86) in a very similar way that is seen in models.